There is no item in your cart
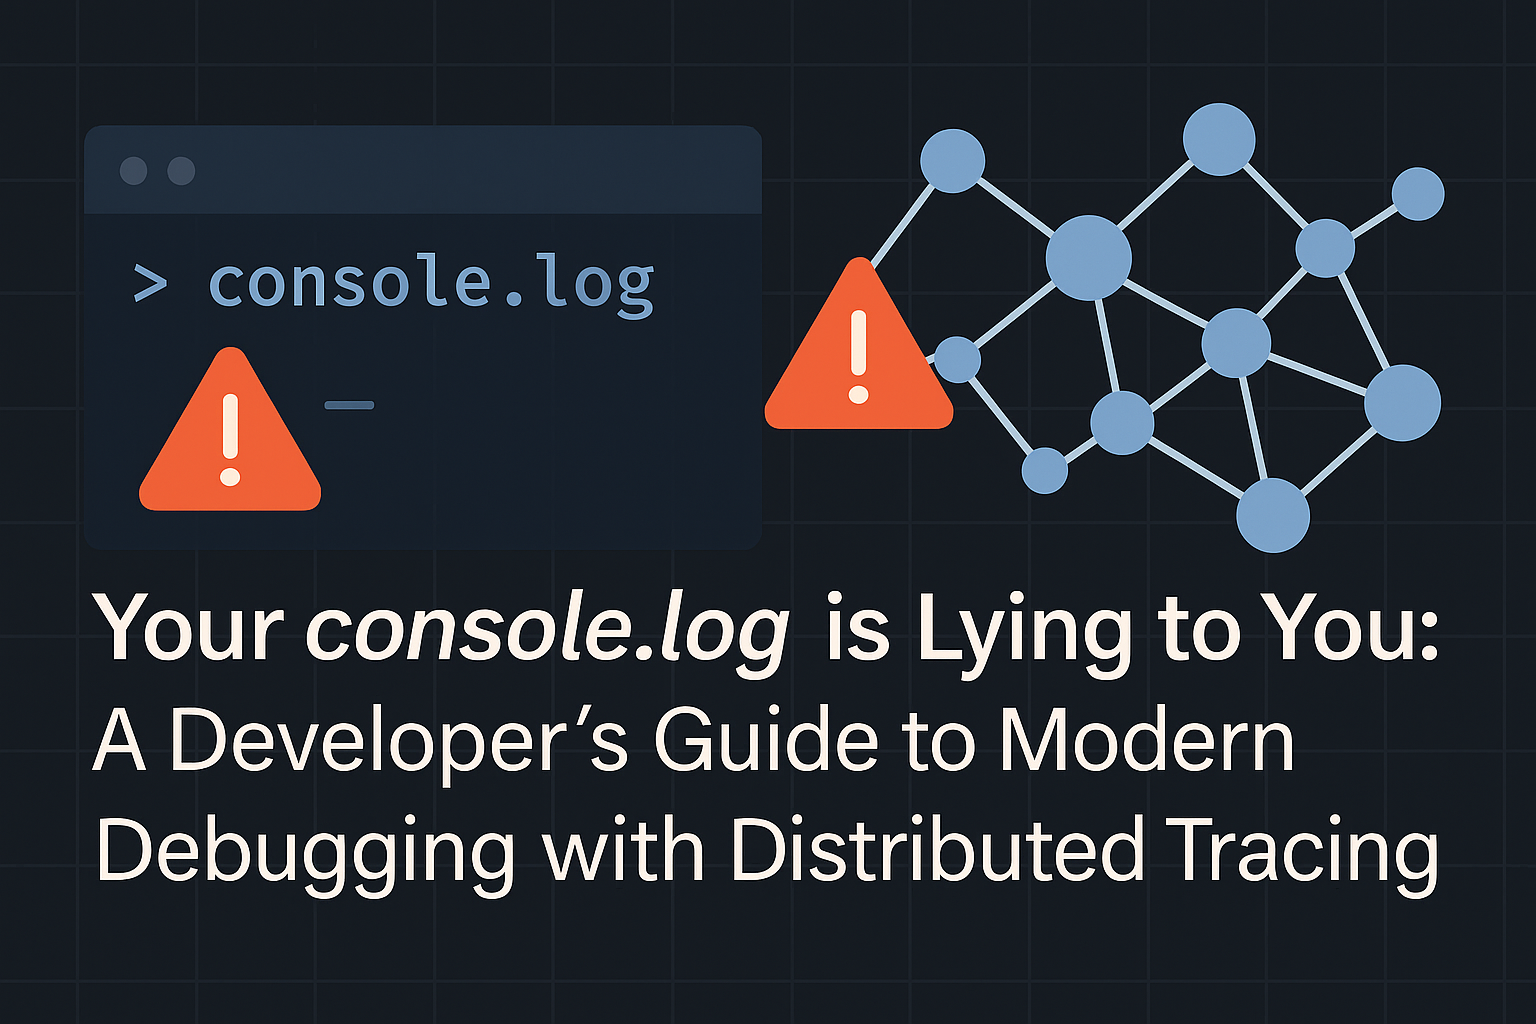
Your console.log is Lying to You: A Developer’s Guide to Modern Debugging with Distributed Tracing
You get a bug report: a user’s request timed out. You check the logs from your web server—they look fine. You check the logs from your API service—they also look fine. You check the database—no errors. So, where did the request fail? The answer is lost somewhere in the silent, invisible space between your services.
For decades, console.log (or print, puts, etc.) has been the developer’s trusty debugging tool. But in a world of microservices, serverless functions, and third-party API calls, logging what happens inside a single service is like trying to understand a city’s traffic by only looking at one intersection. To truly understand modern applications, we need to see the entire journey. This is where Distributed Tracing comes in.
Beyond Logs: The Three Pillars of Observability
Distributed tracing is a core pillar of a modern practice called Observability. To understand it, let’s quickly define the three pillars:
- Logs: Tell you what happened at a specific point in time in a specific service.
- Metrics: Aggregated numbers over time (e.g., CPU usage, error rate).
- Traces: Tell the story of a single request as it travels across every service, database, and API in your system.
While logs are useful, a trace is what gives you the full context—the complete end-to-end story.
Your First Trace: Getting Started with OpenTelemetry
Getting started with tracing is easier than ever thanks to OpenTelemetry (OTel), the open-source industry standard for generating telemetry data. Because it’s a standard, you’re not locked into any single vendor.
- Instrument Your Code: You add the OTel SDK to your application. For many popular frameworks (like Express.js, ASP.NET Core, Spring), OTel provides auto-instrumentation that requires almost no code changes.
- Export the Data: You configure the SDK to send the trace data to an observability platform that can receive and visualize it.
- Visualize the Journey: This is where the magic happens. A platform like [New Relic] ingests your OTel data and turns the journey of a request into a powerful “waterfall” diagram, showing exactly how long it spent in each service.
The “Aha!” Moment: What a Trace Tells You
Once you can see a trace, you gain superpowers:
- Pinpoint Latency: You can instantly see that a request spent 50ms in the API gateway, 300ms in the authentication service, and 800ms in a slow database query. The bottleneck is no longer a mystery.
- Understand Error Propagation: You can see exactly which microservice failed first and how that error cascaded through the system to cause the final user-facing error.
- Visualize System Architecture: Traces naturally map out the dependencies between your services, helping you understand how your distributed system actually works in production.
Conclusion
As our systems become more complex and distributed, our debugging techniques must evolve. console.log tells you what happened in one place; a distributed trace tells you the full story of what happened everywhere. Adopting observability and tracing isn’t just for Site Reliability Engineers (SREs); it’s a critical skill for any developer building modern software. It gives you the X-ray vision you need to build and maintain resilient, high-performance applications.
Gaining X-ray vision into your applications requires a powerful observability platform. [New Relic] provides a unified home for your logs, metrics, and traces, allowing you to debug complex issues in minutes, not days. When you deploy your instrumented applications on a modern platform like [Heroku], you get a complete picture of your app’s health and performance. Explore the essential tools for building and maintaining robust software at SMONE.